EdbViewMatch Class Reference
#include <EdbViewMatch.h>
Inheritance diagram for EdbViewMatch:
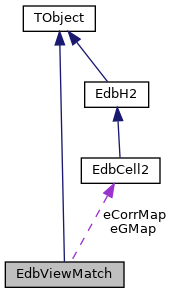
Collaboration diagram for EdbViewMatch:
Public Member Functions | |
| void | AddCluster (float x, float y, float z, float xv, float yv, int view, int frame) |
| void | CalculateCorr () |
| void | CalculateGrRef () |
| void | CutGrRef () |
| void | DrawCorrMap () |
| TNtuple * | DumpGr (const char *name) |
| EdbViewMatch () | |
| void | GenerateCorrectionMatrix (const char *addfile) |
| void | InitCorrMap () |
| void | InitGMap () |
| void | MakeDistortionMap (const char *fname, TEnv &env, const char *addfile=0) |
| void | Print () |
| void | SetPar (TEnv &env) |
| void | SetPixelSize (float xpix, float ypix) |
| virtual | ~EdbViewMatch () |
Public Attributes | |
| float | eAreaMax |
| float | eAreaMin |
| bool | eDumpGr |
| TFile * | eOutputFile |
| float | eVolumeMax |
| float | eVolumeMin |
Private Attributes | |
| TClonesArray | eCl |
| float | eCorrectionMatrixStepX |
| float | eCorrectionMatrixStepY |
| EdbCell2 | eCorrMap |
| EdbCell2 | eGMap |
| TClonesArray | eGr |
| int | eNClMin |
| int | eNXpix |
| int | eNYpix |
| float | eR2CenterMax |
| float | eRmax |
| float | eXpix |
| float | eYpix |
Constructor & Destructor Documentation
◆ EdbViewMatch()
| EdbViewMatch::EdbViewMatch | ( | ) |
◆ ~EdbViewMatch()
|
inlinevirtual |
59{}
Member Function Documentation
◆ AddCluster()
| void EdbViewMatch::AddCluster | ( | float | x, |
| float | y, | ||
| float | z, | ||
| float | xv, | ||
| float | yv, | ||
| int | view, | ||
| int | frame | ||
| ) |
115{
118
119 float v[2]={ x+xv, y+yv };
120 int ir[2]={1,1};
121 TObjArray arr;
122 EdbSegment *s0 = 0;
124 if(n) {
126 for(int i=0; i<n; i++) {
130 }
131 }
133 else {
136 s->AddElement(c);
138 }
139}
int SelectObjectsC(int iv[2], int ir[2], TObjArray &arr)
Definition: EdbCell2.cpp:707
Definition: EdbViewMatch.h:18
◆ CalculateCorr()
| void EdbViewMatch::CalculateCorr | ( | ) |
192{
195 for(int i=0; i<ngr; i++) {
199 for( int ic=0; ic<nc; ic++ ) {
204 if(!dxy) { Log(1,"EdbViewMatch::CalculateCorr","WARNING: null dxy: ic=%d i=%d cx,cy: %f %f",ic,i, c->eX, c->eY); continue; }
205 (*dxy)[0] += dx;
206 (*dxy)[1] += dy;
208 }
209 }
210
213 for( int i=0; i<nc; i++ ) {
216 (*dxy)[0] /= w;
217 (*dxy)[1] /= w;
218 }
219
220}
◆ CalculateGrRef()
| void EdbViewMatch::CalculateGrRef | ( | ) |
143{
144 // take as grain reference position of the most central cluster
145
147 for(int i=0; i<ngr; i++) {
150 //if(nc<eNClMin) { s->GetElements()->Clear(); continue; }
152 for( int ic=0; ic<nc; ic++ ) {
156 }
157 //if(rmin>eR2CenterMax) s->GetElements()->Clear();
158 }
159}
◆ CutGrRef()
| void EdbViewMatch::CutGrRef | ( | ) |
163{
164 // remove marginal grains from calculation
166 for(int i=0; i<ngr; i++) {
171 }
172}
◆ DrawCorrMap()
| void EdbViewMatch::DrawCorrMap | ( | ) |
224{
225 bool batch = gROOT->IsBatch();
228 gROOT->SetBatch();
229 }
230
232
233 gStyle->SetPalette(1);
234 gStyle->SetOptStat(0);
235 gPad->SetGridx(1);
236 gPad->SetGridy(1);
237
238 float margin=10;
243
244 TH2F *hh = new TH2F("hh","Corrections map",100,minXborder,maxXborder,100,minYborder,maxYborder);
245 hh->GetXaxis()->SetTitle("X (#mum)");
246 hh->GetYaxis()->SetTitle("Y (#mum)");
247 hh->Draw();
248
250 plate->SetFillColor(16);
251 plate->SetFillStyle(3001);
252 plate->Draw();
253
254 Double_t meanx=0, meany=0, wtot=0;
255 float scale = 15.;
257 for( int i=0; i<nc; i++ ) {
262 float dx = (*dxy)[0];
263 float dy = (*dxy)[1];
264
265 TArrow *arrow = new TArrow(x,y,x+scale*dx,y+scale*dy,0.01);
266 arrow->SetLineWidth(1);
267 arrow->Draw();
268
269 meanx += dx;
270 meany += dy;
271 wtot += w;
272 }
273
274 meanx /= wtot;
275 meany /= wtot;
276 printf("\nmeanx = %g meany = %g wtot = %f\n", meanx, meany, wtot);
277
280 cc->Write("corr_map");
281 gROOT->SetBatch(batch);
282}
TH2F * DrawH2(const char *name="plot2d", const char *title="EdbH2plot2D")
Definition: EdbCell2.cpp:187
new TCanvas()
◆ DumpGr()
| TNtuple * EdbViewMatch::DumpGr | ( | const char * | name | ) |
◆ GenerateCorrectionMatrix()
| void EdbViewMatch::GenerateCorrectionMatrix | ( | const char * | addfile | ) |
286{
292
299
300 vdx[i] = arr->At(0);
301 vdy[i] = arr->At(1);
302 }
303
306
307 TH2F hdx("hdx","CorrectionMatrix dX",eNXpix, -eXpix*eNXpix/2., eXpix*eNXpix/2., eNYpix, -eYpix*eNYpix/2., eYpix*eNYpix/2. );
308 TH2F hdy("hdy","CorrectionMatrix dY",eNXpix, -eXpix*eNXpix/2., eXpix*eNXpix/2., eNYpix, -eYpix*eNYpix/2., eYpix*eNYpix/2. );
309
310 FILE *fadd=0;
311 if(addfile) fadd = fopen(addfile,"r");
312 char str[256];
313
314 if(fadd) fgets(str, 256, fadd); //skip first line
315 int iadd, jadd;
316 float xadd, yadd, dxadd, dyadd;
317
318 FILE *fmatr = fopen("correction_matrix.txt","w");
320
325 //float dx = gdx->Interpolate(x,y);
326 //float dy = gdy->Interpolate(x,y);
329
330 if(fadd) {
331 if(fgets(str, 256, fadd)==NULL) Log(1,"GenerateCorrectionMatrix","ERROR: addfile is not correct");
332 if( sscanf(str, "%d %d %f %f %f %f", &iadd, &jadd, &xadd, &yadd, &dxadd, &dyadd) != 6 ) {
334 break;
335 }
336 dx += dxadd;
337 dy += dyadd;
338 }
339 fprintf(fmatr,"%5d %5d %12.6f %12.6f %11.6f %11.6f\n", i, j, x,y,dx,dy);
340
341 hdx.Fill(x,y,dx);
342 hdy.Fill(x,y,dy);
343 }
344 }
345 fclose(fmatr);
347
348 bool batch = gROOT->IsBatch();
351 gROOT->SetBatch();
352 }
353
354 //TCanvas c("c","CorrectionMatrix", 700, 1200 );
355 //c.Divide(1,2);
356 //c.cd(1); hdx.Draw("colz");
357 //c.cd(2); hdy.Draw("colz");
358 //c.Write();
359 hdx.Write("hdx");
360 hdy.Write("hdy");
361 gdx->Write("gdx");
362 gdy->Write("gdy");
363 gROOT->SetBatch(batch);
364
365}
fclose(pFile)
◆ InitCorrMap()
| void EdbViewMatch::InitCorrMap | ( | ) |
82{
83 // matrix of the corrections in each entry is TArrayD with 2 entries:(dx,dy)
86 int n[2] = { int((ma[0]-mi[0])/eCorrectionMatrixStepX), int((ma[1]-mi[1])/eCorrectionMatrixStepY) };
87
88 eCorrectionMatrixStepX = (ma[0]-mi[0])/n[0];
89 eCorrectionMatrixStepY = (ma[1]-mi[1])/n[1];
90 n[0] = int((ma[0]-mi[0]+1.)/eCorrectionMatrixStepX);
91 n[1] = int((ma[1]-mi[1]+1.)/eCorrectionMatrixStepY);
92
96 for( int i=0; i<nc; i++ ) {
100 }
101
102}
◆ InitGMap()
| void EdbViewMatch::InitGMap | ( | ) |
◆ MakeDistortionMap()
| void EdbViewMatch::MakeDistortionMap | ( | const char * | fname, |
| TEnv & | env, | ||
| const char * | addfile = 0 |
||
| ) |
393{
396 InitGMap();
397 InitCorrMap();
399
402 //float X0 = v->GetXview();
403 //float Y0 = v->GetYview();
405 float Y0 = 0;
406
407 for(int i=0; i<n; i++) {
410 printf("%6d ", ncl);
411
412 for(int ic=0; ic<ncl; ic++) {
415 AddCluster( c->eX, c->eY, c->eZ, v->GetXview()-X0, v->GetYview()-Y0, v->GetViewID(), c->GetFrame() );
416 }
417 }
418 }
419 printf("\n");
420
421 CalculateGrRef();
422
425 CutGrRef();
426 CalculateCorr();
427 DrawCorrMap();
428 GenerateCorrectionMatrix(addfile);
430 eOutputFile->Close();
431 Print();
432}
Definition: EdbCluster.h:19
Definition: EdbRun.h:75
EdbView * GetEntry(int entry, int ih=1, int icl=0, int iseg=1, int itr=0, int ifr=0)
Definition: EdbRun.cxx:462
void AddCluster(float x, float y, float z, float xv, float yv, int view, int frame)
Definition: EdbViewMatch.cxx:114
void GenerateCorrectionMatrix(const char *addfile)
Definition: EdbViewMatch.cxx:285
TEnv cenv("emrec")
◆ Print()
| void EdbViewMatch::Print | ( | ) |
369{
370 printf("\n-----------------------------------------------------------------------------------------------------\n");
373 int icgr=0, iccl=0;
374 for(int i=0; i<ngr; i++) {
377
378 //if(nc>500) printf("grain %d with %d cl\n", i, nc);
379 }
380 printf("\n%d clusters processed\n",ncl);
381 printf("\n%d grains found\n",ngr);
382 printf("\n%d grains used (ncl > %d and closer then %f to center) \n",icgr, eNClMin, eR2CenterMax );
383 printf("\n%d clusters used in good grains\n",iccl);
384 printf("Matrix definition: %d %d %f %f view size: %f %f\n", eNXpix, eNYpix, eXpix, eYpix, eNXpix*eXpix, eNYpix*eYpix );
385
388 printf("-----------------------------------------------------------------------------------------------------\n");
389}
◆ SetPar()
| void EdbViewMatch::SetPar | ( | TEnv & | env | ) |
53{
57
62
64
65 sscanf( env.GetValue("viewdist.ClusterAreaLimits", "0 90000000"), "%f %f", &eAreaMin, &eAreaMax);
66 sscanf( env.GetValue("viewdist.ClusterVolumeLimits", "0 90000000"), "%f %f", &eVolumeMin, &eVolumeMax);
67
68 printf("\n----------------------- Processing Parameters ---------------------------\n");
73 printf("Matrix: %d x %d pixels, \t %15.7f x %15.7f microns", eNXpix, eNYpix, eXpix*eNXpix, eYpix*eNYpix);
76 printf("-------------------------------------------------------------------------\n\n");
77
78}
◆ SetPixelSize()
Member Data Documentation
◆ eAreaMax
| float EdbViewMatch::eAreaMax |
◆ eAreaMin
| float EdbViewMatch::eAreaMin |
◆ eCl
|
private |
◆ eCorrectionMatrixStepX
|
private |
◆ eCorrectionMatrixStepY
|
private |
◆ eCorrMap
|
private |
◆ eDumpGr
| bool EdbViewMatch::eDumpGr |
◆ eGMap
|
private |
◆ eGr
|
private |
◆ eNClMin
|
private |
◆ eNXpix
|
private |
◆ eNYpix
|
private |
◆ eOutputFile
| TFile* EdbViewMatch::eOutputFile |
◆ eR2CenterMax
|
private |
◆ eRmax
|
private |
◆ eVolumeMax
| float EdbViewMatch::eVolumeMax |
◆ eVolumeMin
| float EdbViewMatch::eVolumeMin |
◆ eXpix
|
private |
◆ eYpix
|
private |
The documentation for this class was generated from the following files:
- /home/antonio/fedra_doxygen/src/libEMC/EdbViewMatch.h
- /home/antonio/fedra_doxygen/src/libEMC/EdbViewMatch.cxx